Thanks to the wonderful Zplots software, we can measure most important parameters of a transmission line quickly and easily.
What we might like to know is:
1) Characteristic impedance versus frequency;
2) Velocity factor versus frequency;
3) Cable loss versus frequency.
All we need is getting access to the far end of our transmission line so we can measure both open and shorted cable.
In this example, I used a RigExpert AA-170 antenna analyzer connected to 12.8 meters of the RG-58C/U cable.
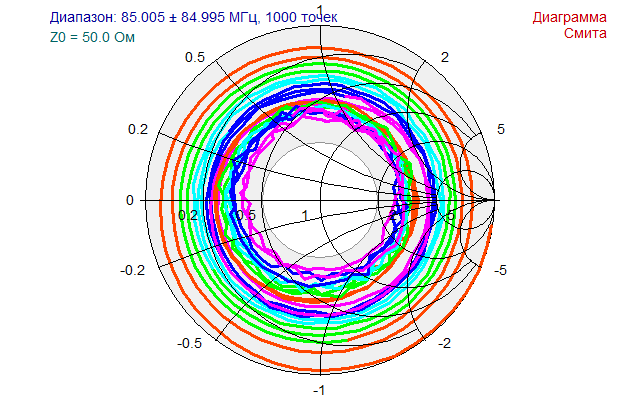
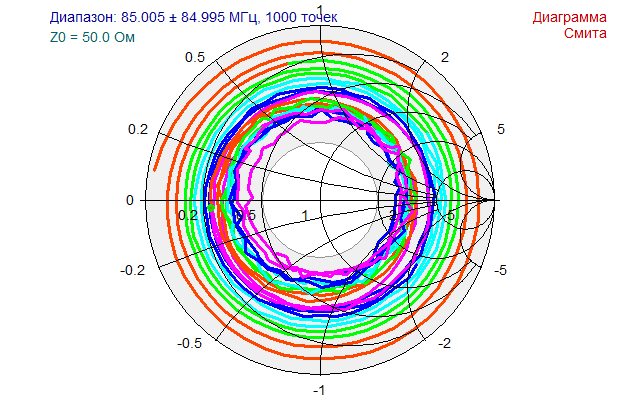
First of all, an open cable was measured by using the AntScope program, from 10 kHz to 170 Mhz with 1000 points. I save the result as “open1.s1p” file by using the following menu: File – Export – Touchstone – S,MA . Another measurement were done with a shorted cable, the result was saved to “short1.s1p”.

“Open” and “short” graphs in AntScope:
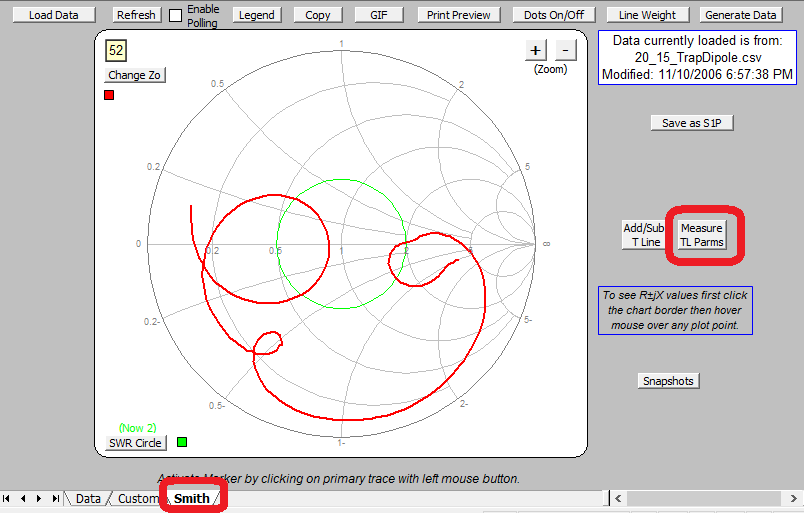
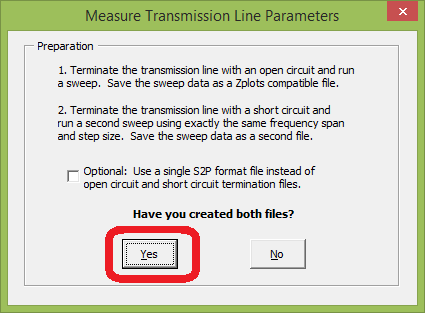
Before opening Zplots, I had to enable macros in Excel so the program can work. At the Smith tab of the Zplots, I pressed the “Measure TL Params” button:
I then had to press Yes to confirm:
In the next window, I entered the length of my cable and pressed OK:
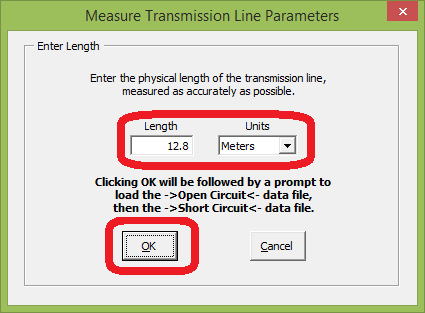
I was then asked for two files, and I selected “open1.s1p” and “short1.s1p” which I previously saved in AntScope.
Voila! I could now study the result.
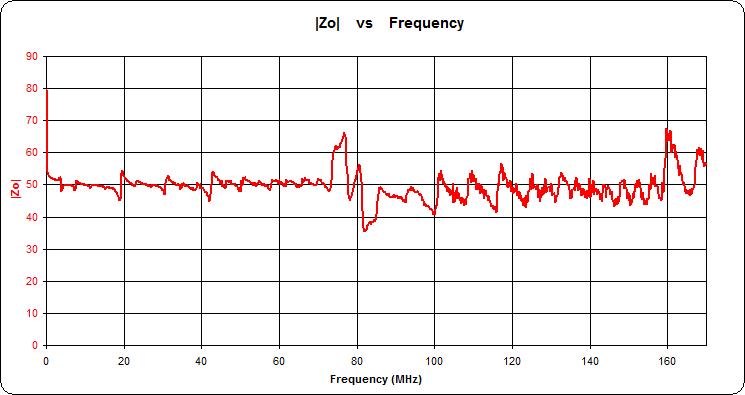
Characteristic impedance (|Z0|):
Please notice that the |Z0| is not a smooth line due to various effects. The average value is displayed in numerical form at the bottom-right corner of the Zplots:

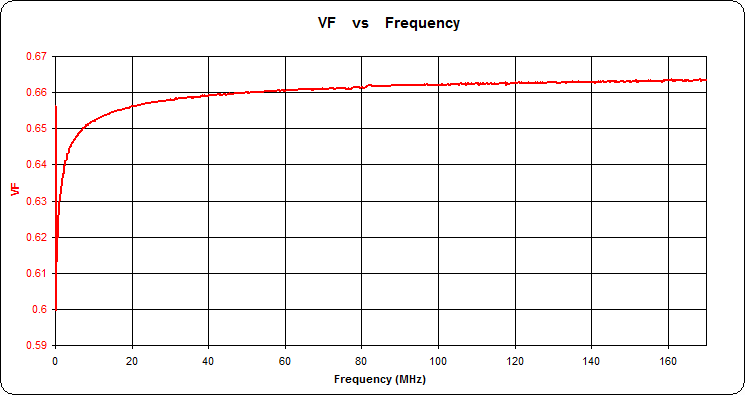
Velocity factor (VF):
Notice that the velocity factor sufficiently drops at frequencies lower than approximately 1 MHz.
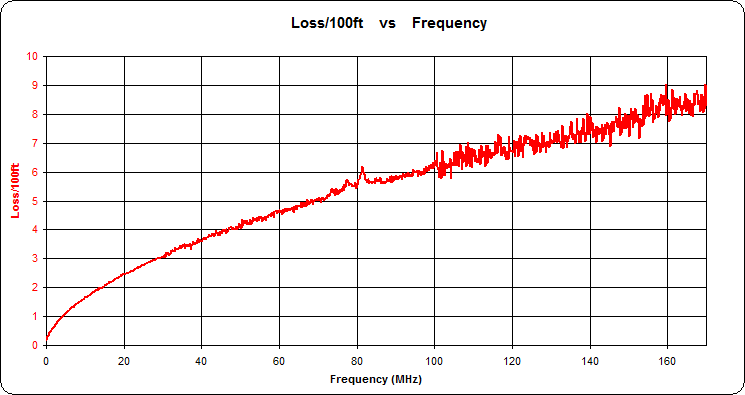
Cable loss (Loss/100ft):
In addition to displaying the graph, the program calculates coefficients K0, K1 and K2:

You may use these coefficients in other programs (such as AntScope) as characteristics of your cable.
See also: Transmission Line Measurement Techniques by KN5L
Denis UR8US (ex UU9JDR)
27-Jan-2015

