A Time Domain Reflectometer (actually, a Frequency Domain Reflectometer) mode which is built into the RigExpert AA-230PRO (and which is available in AntScope software for AA-230 and AA-230PRO analyzers) may be successfully used to check cable TV lines at home.Every peak at the impulse response graph corresponds to the location of known discontinuity (this may be a cable junction, a coupler or a power divider). Any other peak may display a hidden problem in a cable line, which has to be fixed. The overal state of the the cable itself, junctions and other parts of a cable line is usually unknown, since even new components may be defective.
Is it possible to connect an antenna analyzer to the cable line? Is there any chance to “burn” the analyzer, your TV set or even cable operator’s equipment? Let’s see:
Cable operators never want us connect devices other than TV sets or cable modems to their lines. On the other hand, operator’s equipment as well as modern subscriber’s devices (TV sets and cable modems) survives when a high-frequency signal with several volts of amplitude it applied to the line. This is why we will never “burn” such devices with AA-230 or AA-230PRO. Additionally, analyzers are also OK being connected to the output of a cable modem or to the incoming cable line. However, there might be a relatively high level with the mains (50 or 60 Hz) voltage between the chassis of a PC and the outer conductor of the cable. This is why it is recommended to use a laptop computer disconnected from the mains line when taking measurements using AA-230 or AA-230PRO analyzers.
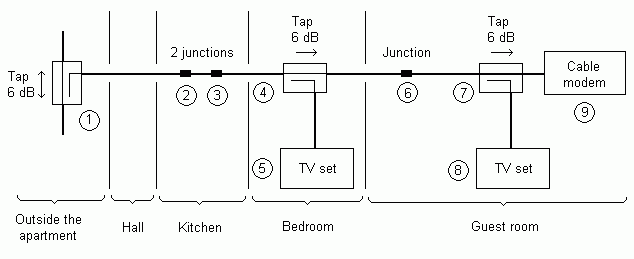
The following configuration of a cable line was used in experiments:

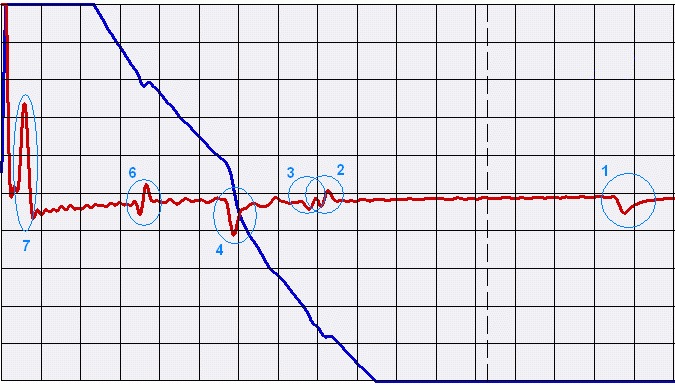
A bi-directional tap 1 is connected to the operator’s line. The cable is fed through the hall to the kitchen. Two junctions 2 and 3 are separated by a small piece of a cable. TV set 5 is connected to the tap 4. Another junction 6 is located in the guest room, where TV set 8 and cable modem 9 are connected through the tap 7. Of course, this is not a best configuration; however, it is optimized for the higher signal level at the cable modem.AA-230PRO connected in place of the cable modem 9 was used in the first experiment. In the AntScope software, velocity factor was set to 0.8 (usual for most TV cables).

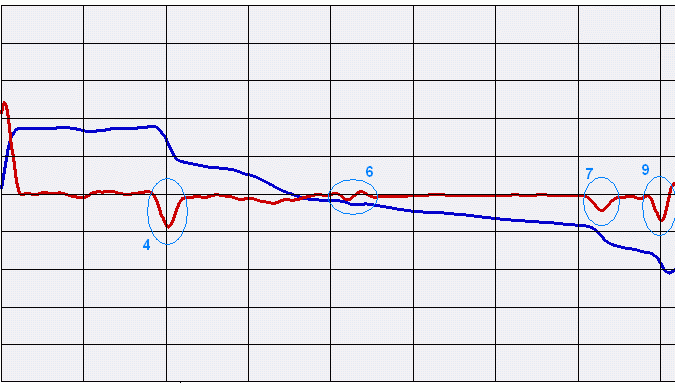
On the red impulse response graph, there are visible reflections from tap 7, junction 6, tap 4 (this peak is lower since tap 7 has some signal loss), junctions 3 and 2, and tap 1. Measured distance to these peaks approximately corresponds to the actual distance. There are no other peaks – this means there are no hidden defects in the cable.For the second experiment, the analyzer was connected in place of the junction 3.

There are visible reflections from tap 4, junction 6, coupler 7 and cable modem 9 (which was connected to the line in this experiment). There are no other peaks on this graph.
On both graphs, there are no visible reflections from TV sets 5 and 8. Possibly, this is because of high attenuation at the taps.
Denis Nechitailov, UU9JDR
